How to create simple aggregated dashboards using google spreadsheets and python
Why pay for BI tools when the data you need is readily available in a spreadsheet ?
This post will essentially give you an idea on how I provide data to some of our key stakeholders using two pieces of technology - python and google spreadsheets.
The assumption here is that you have data in a database somewhere on which you want to do aggregations on.
My business dashboard example is primarily to give the Account management team an idea of which users are assigned to which licenses and whether they are still attached to some legacy licenses (old licenses). The team needs to periodically check this dashboard to ensure that there are no users who havent been upgraded to the latest licenses.
1.Use Python to connect to the database(s)
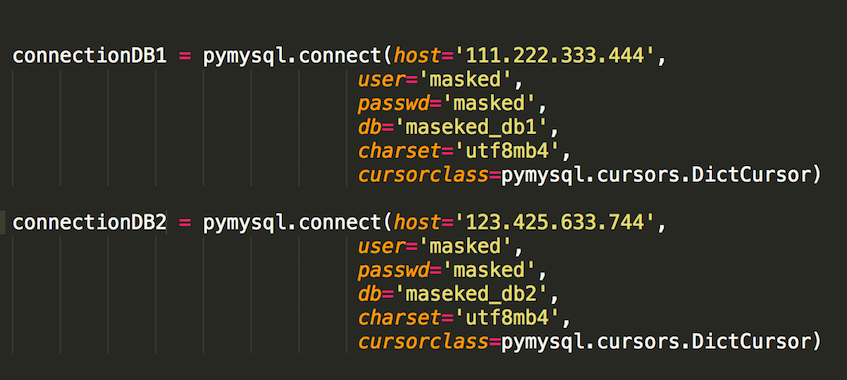
I use the pymysql library. This keeps the code really simple and you don’t have to worry about the versions of the python to use. On my Macbook pro, I use python 3.
In my example, I have to connect to two different databases because they represent two different segregated datasets.

After that I import the necessary libraries and run the sql query in python.

The mySQLConnector I have used here is a python class I have used to hide the connection details (which is shown in the previous image). The idea here is to show you how you can execute queries in python and explain the concept to you.
2.Use Google Spreadsheets to write the aggregated data
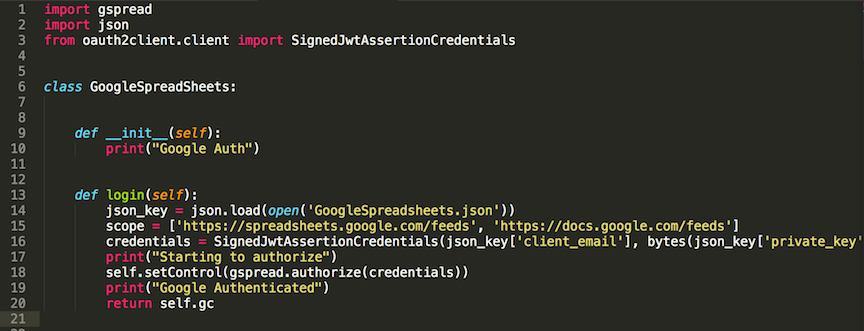
So we have already imported a class for Google Spreadsheet above. The class contains the following :

As you see we have used the gspread libraries to help with writing to Google spreadsheets.The key thing when you use these libraries are that there is documentation about how to give access permissions to your python code so that it can write to google spreadsheets. I use OAuth2 for access permissions.
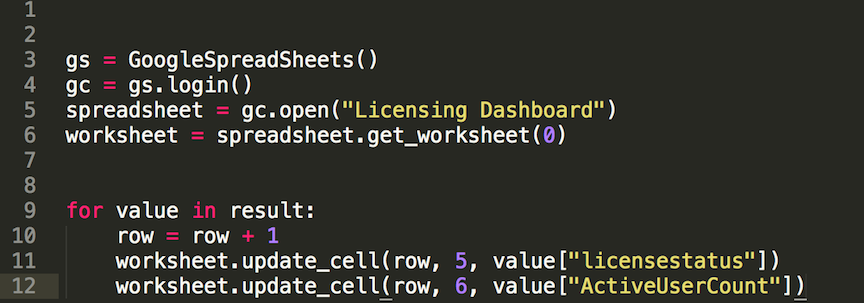
3.Start writing the data to the Google Spreadsheet

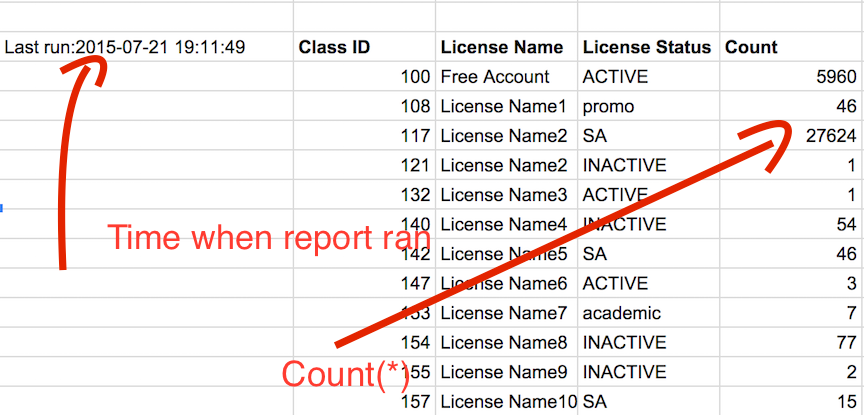
Sample Aggregated Sheet

